Grafana
This guide contains information to set up a Grafana Source in Vanus Connect.
Introduction
Grafana is an open-source platform for data visualization and analytics. It enables users to create and share dashboards, charts, and alerts across multiple data sources.
The Grafana Source is a webhook server that enables you to establish an endpoint for receiving events from Grafana. To achieve this, it is necessary to establish a connection within Grafana.
Prerequisites
- A Vanus Cloud account
- A Grafana instance or a Grafana cloud account
Getting Started
To obtain all Grafana events using Vanus Connect, follow these steps:
Grafana Connection Settings
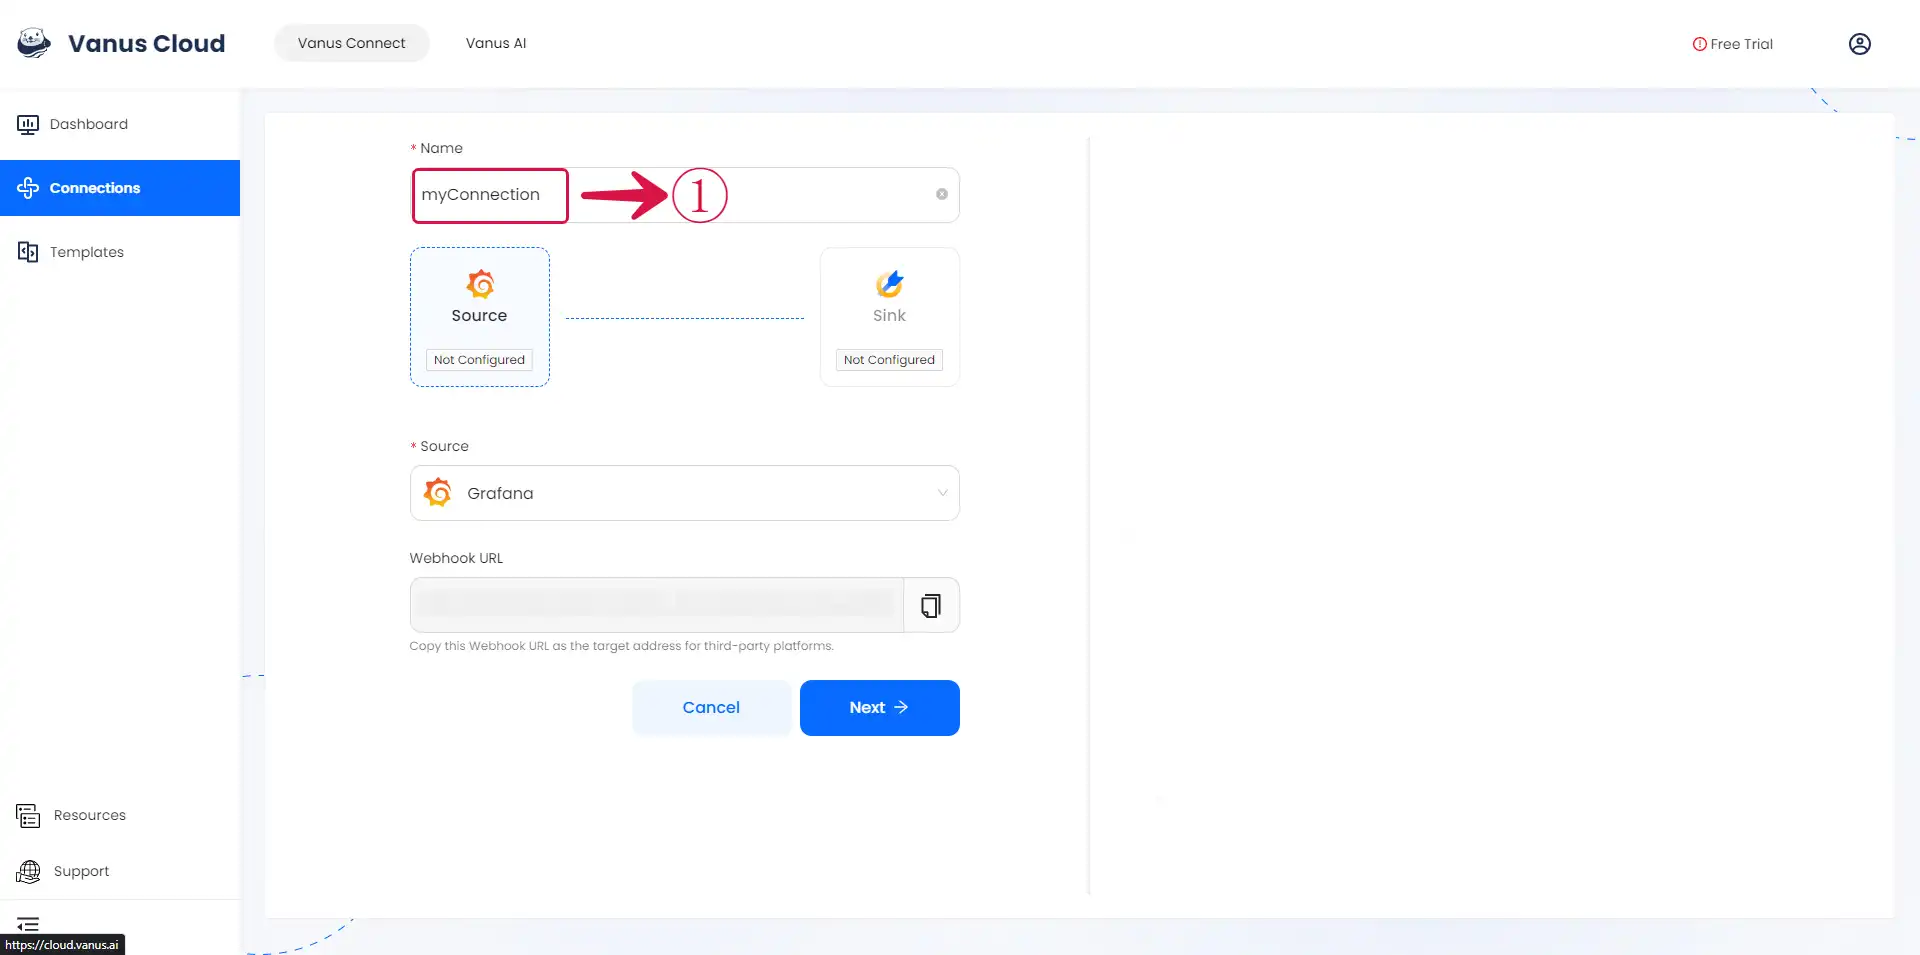
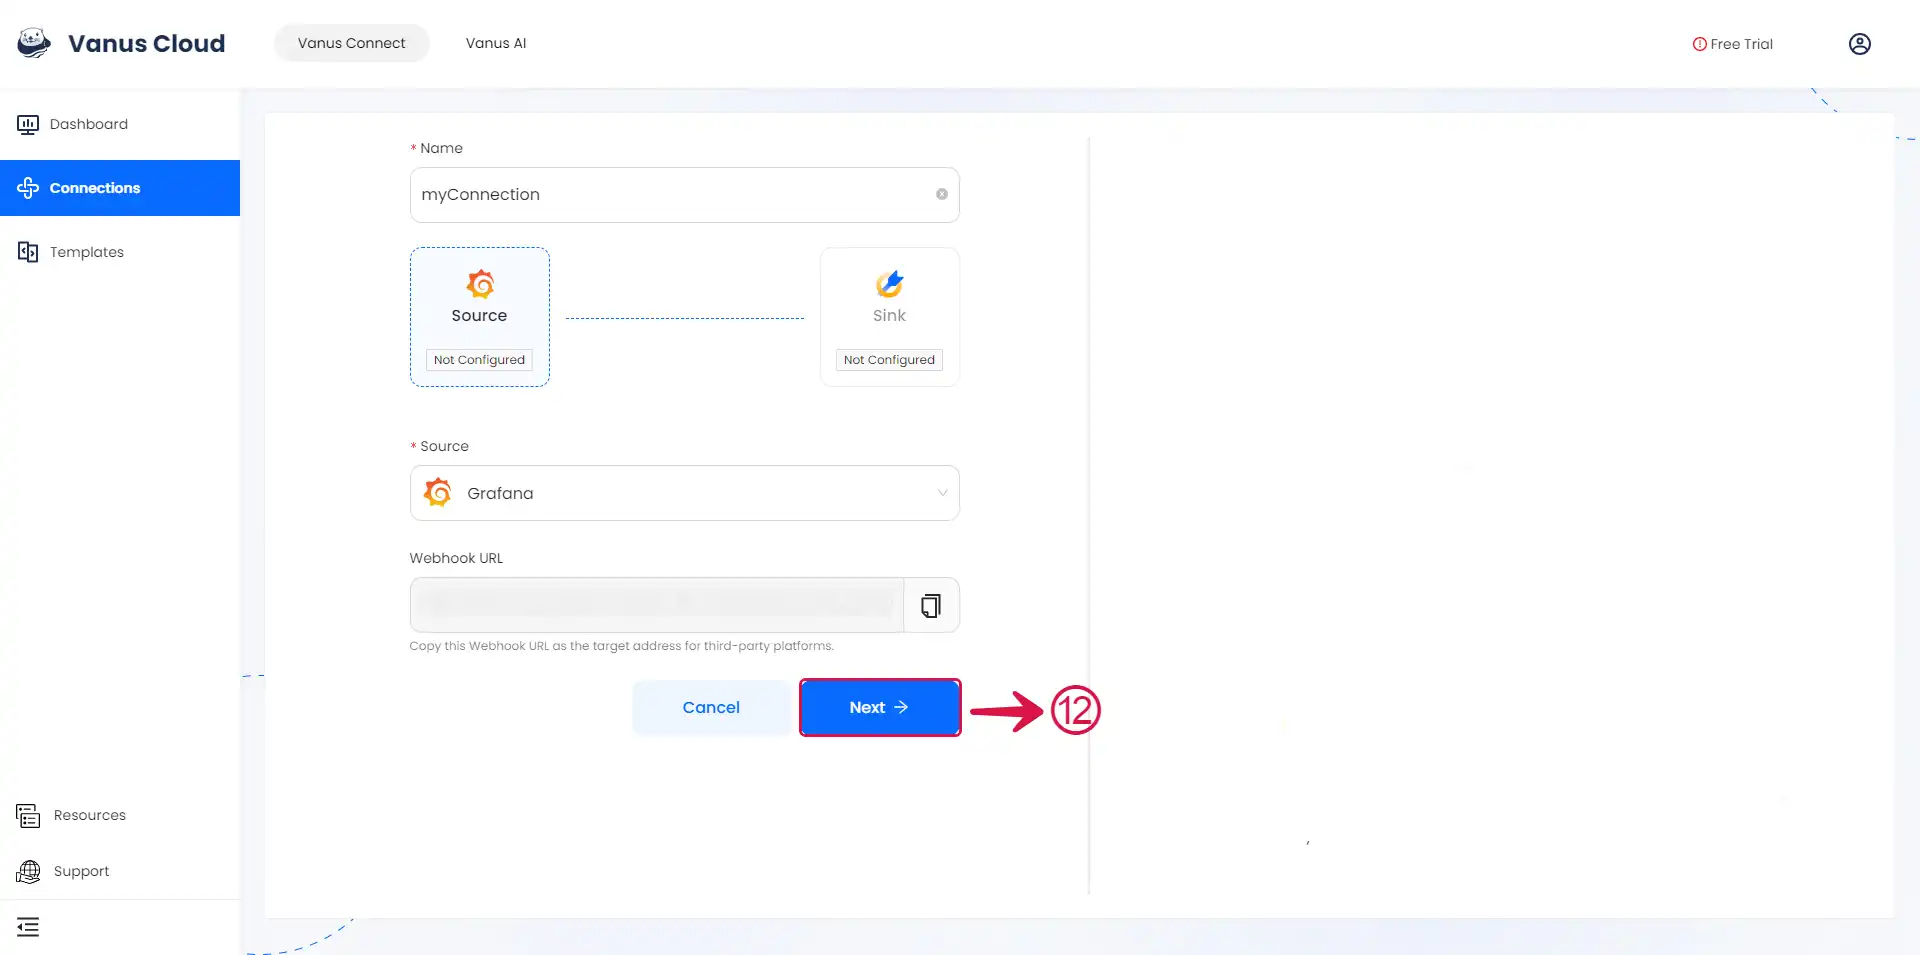
- Write a Name① for your connection in Vanus Connect.
Configuring Grafana to send Events
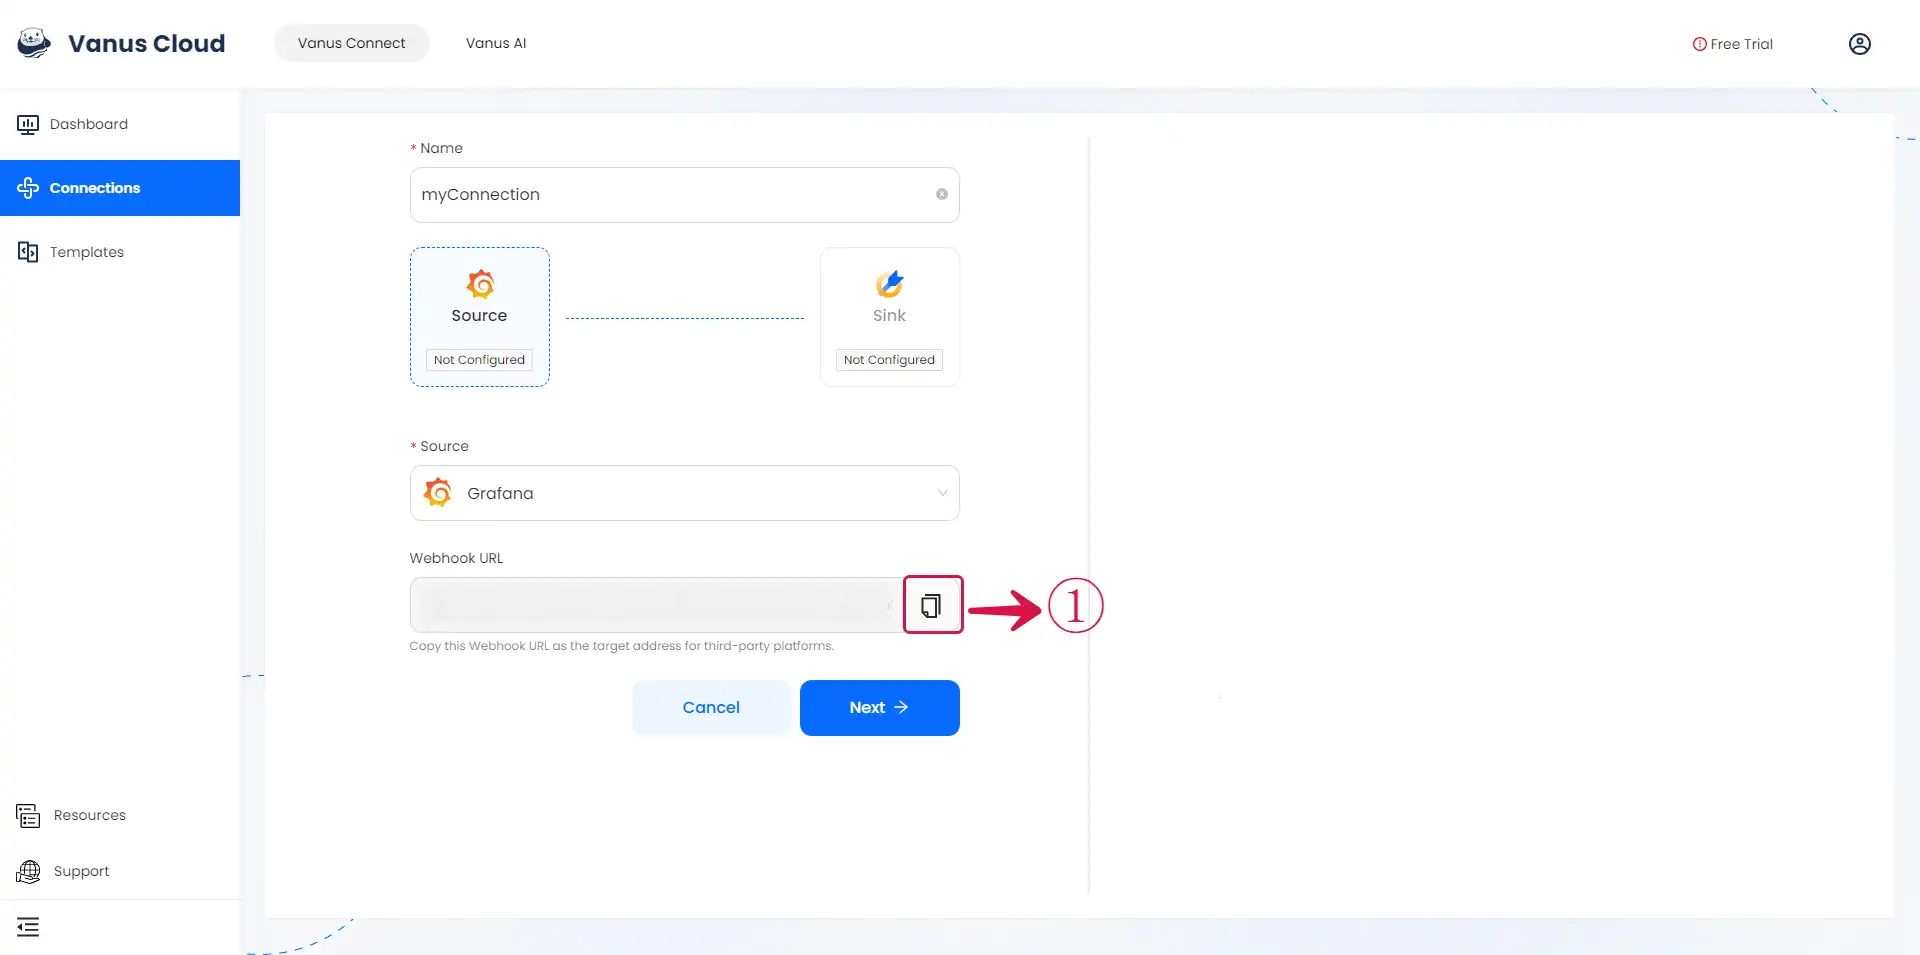
- Click on the copy① icon to copy the Webhook URL. Use the Webhook URL to receive events.
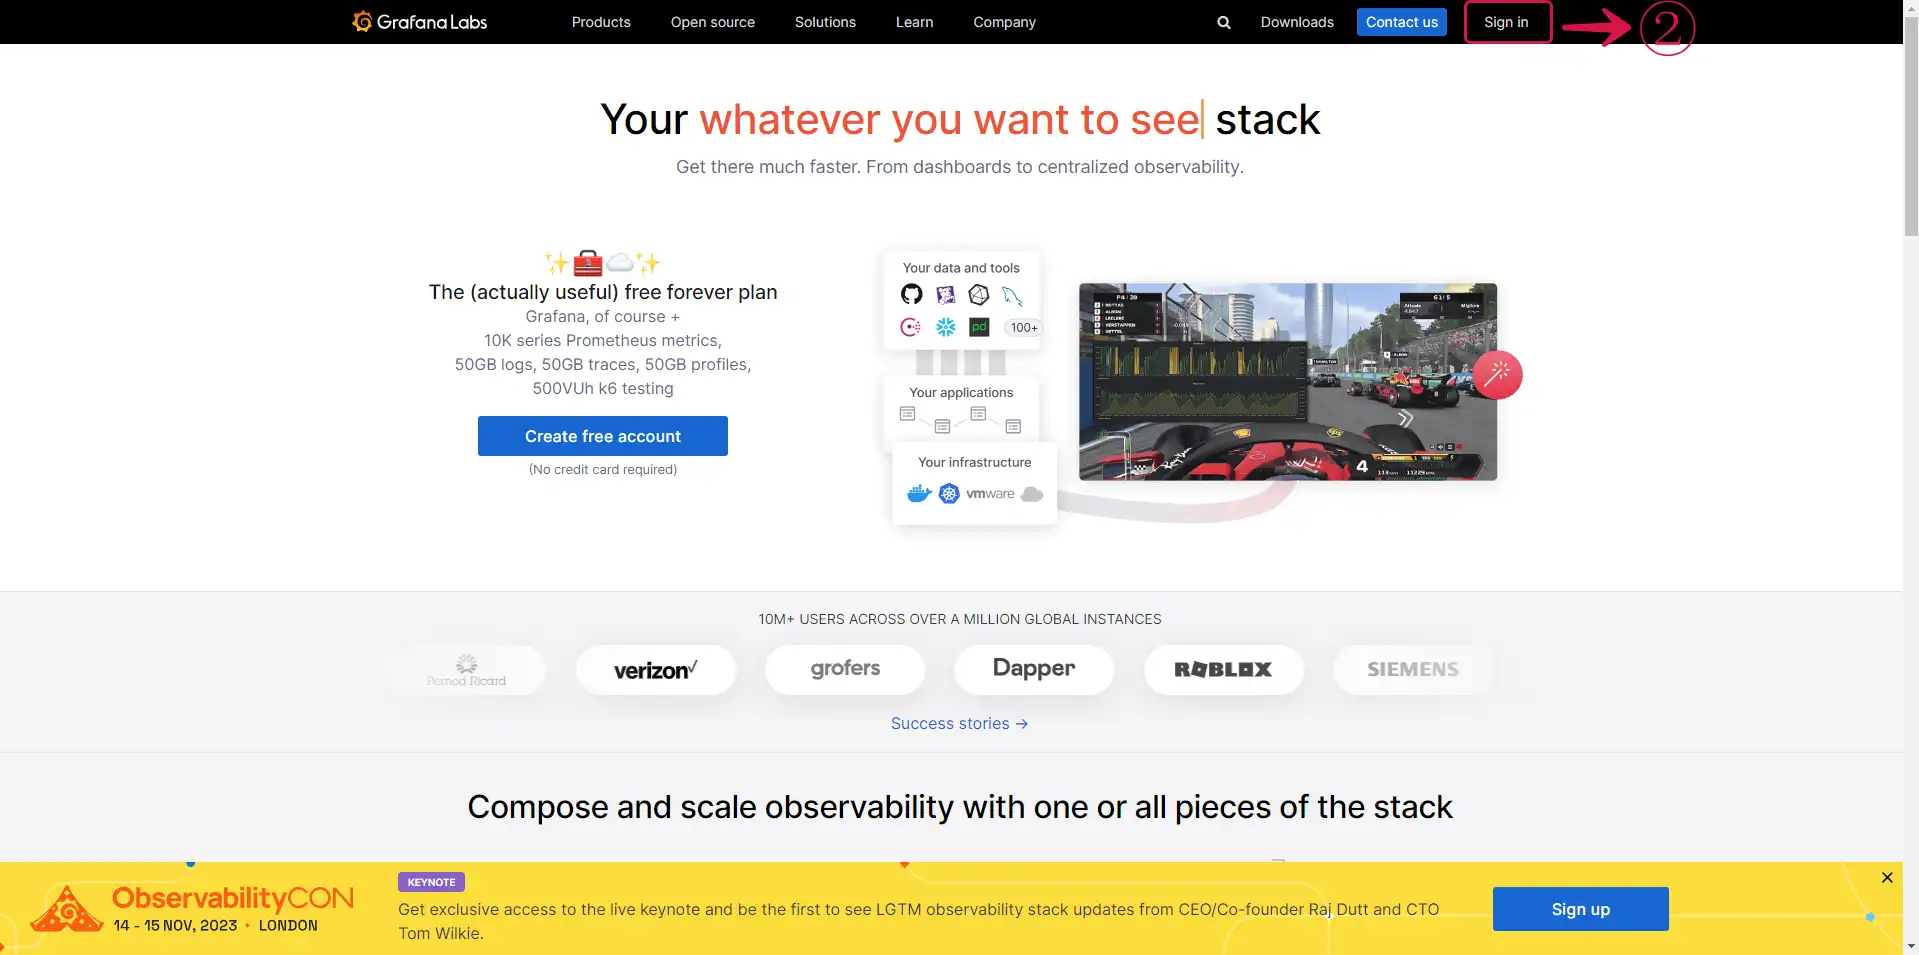
- Log in to your [Grafana Account]②(https://grafana.com).
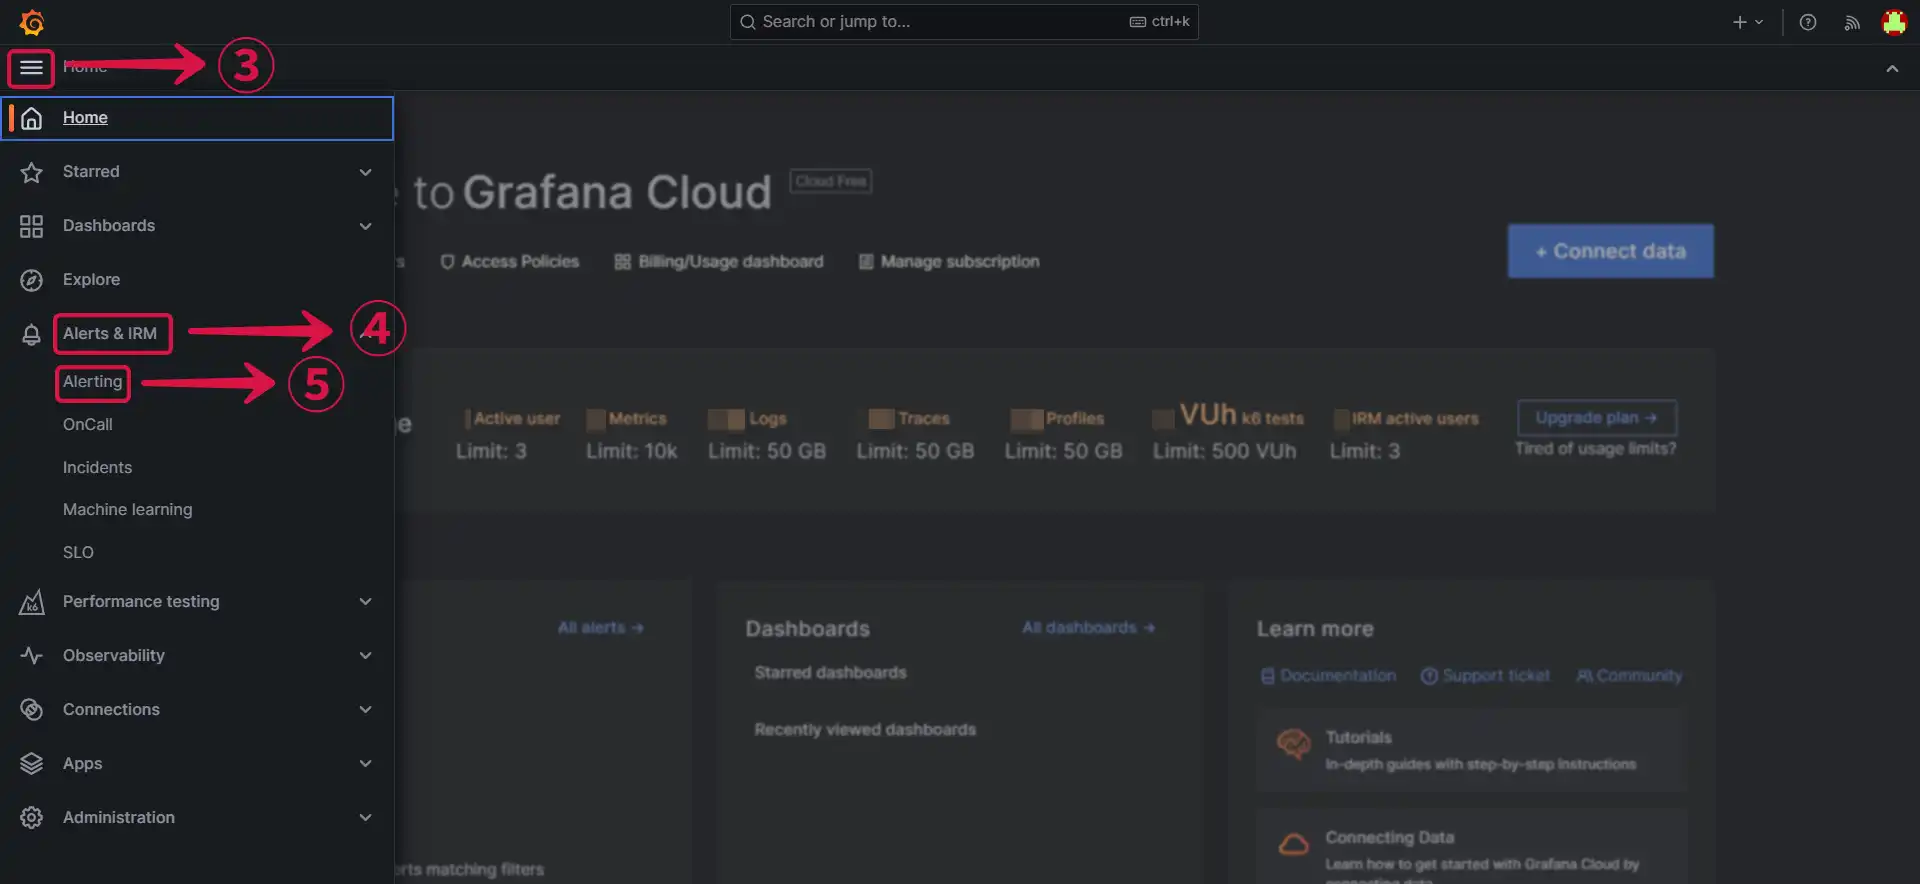
- Click on the hamburger button③, navigate to Alerts & IRM④, and select Alerting⑤.
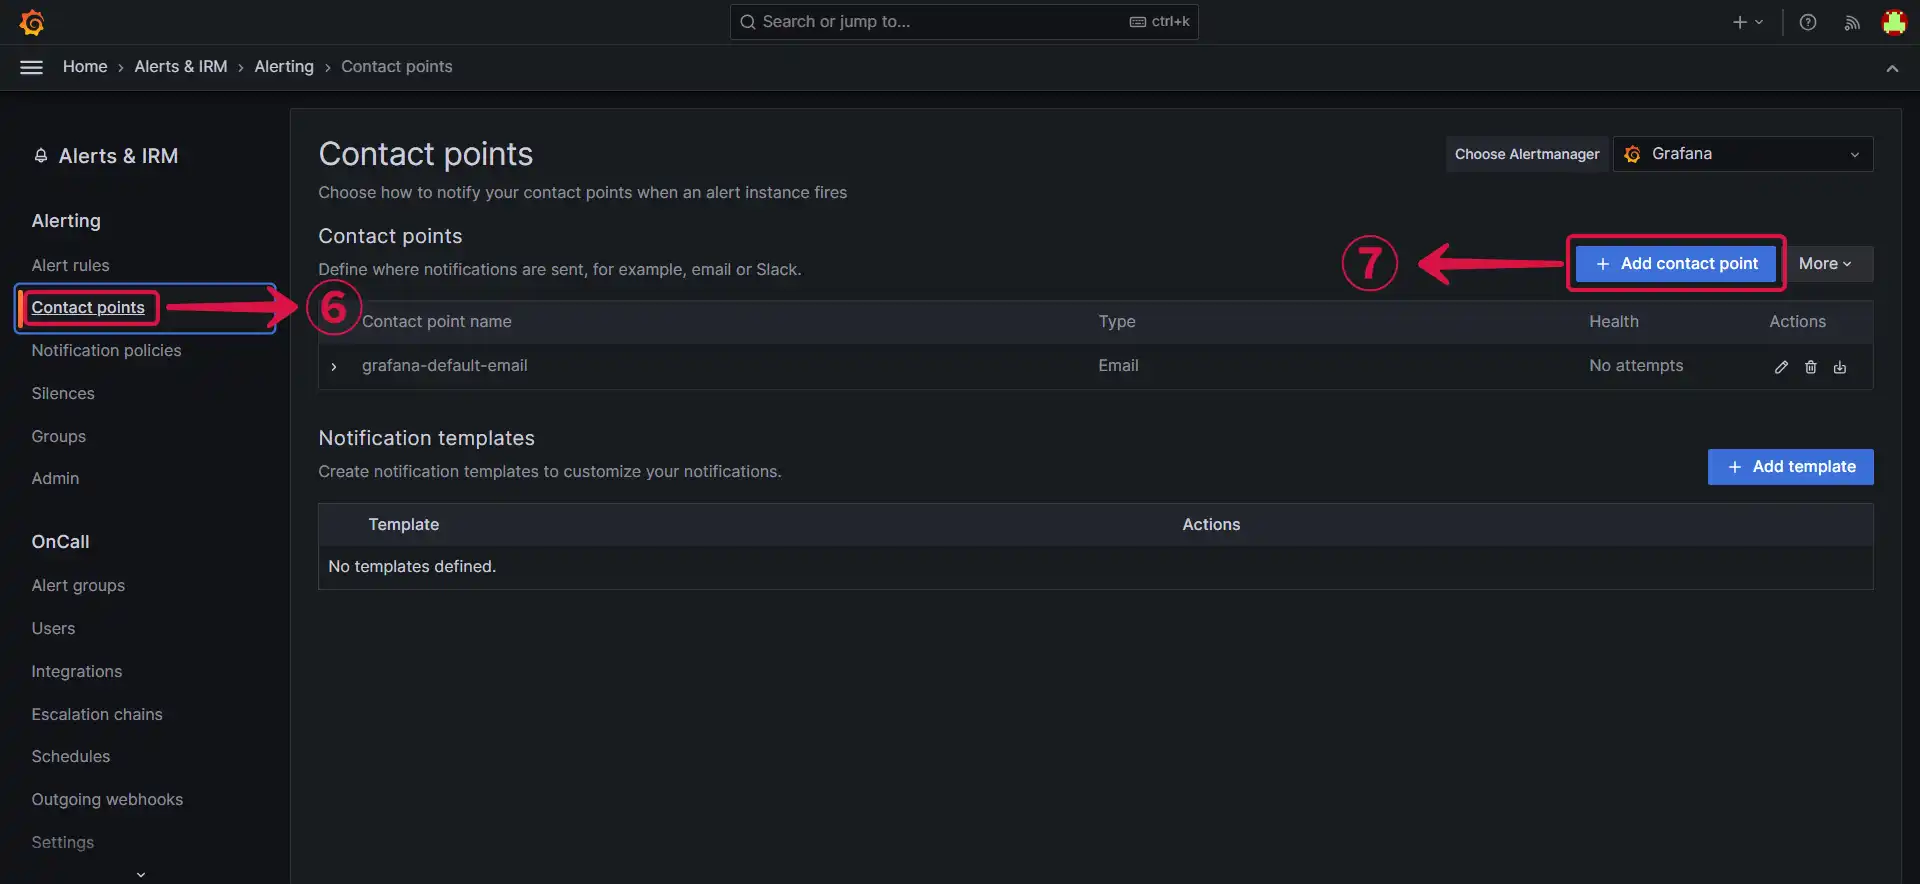
- Select Contact points⑥, and click on Add contact point⑦.
- Name⑧ your contact point, click on integration and select webhook⑨, provide the payload URL⑩ from Vanus Connect, and Save contact point⑪.
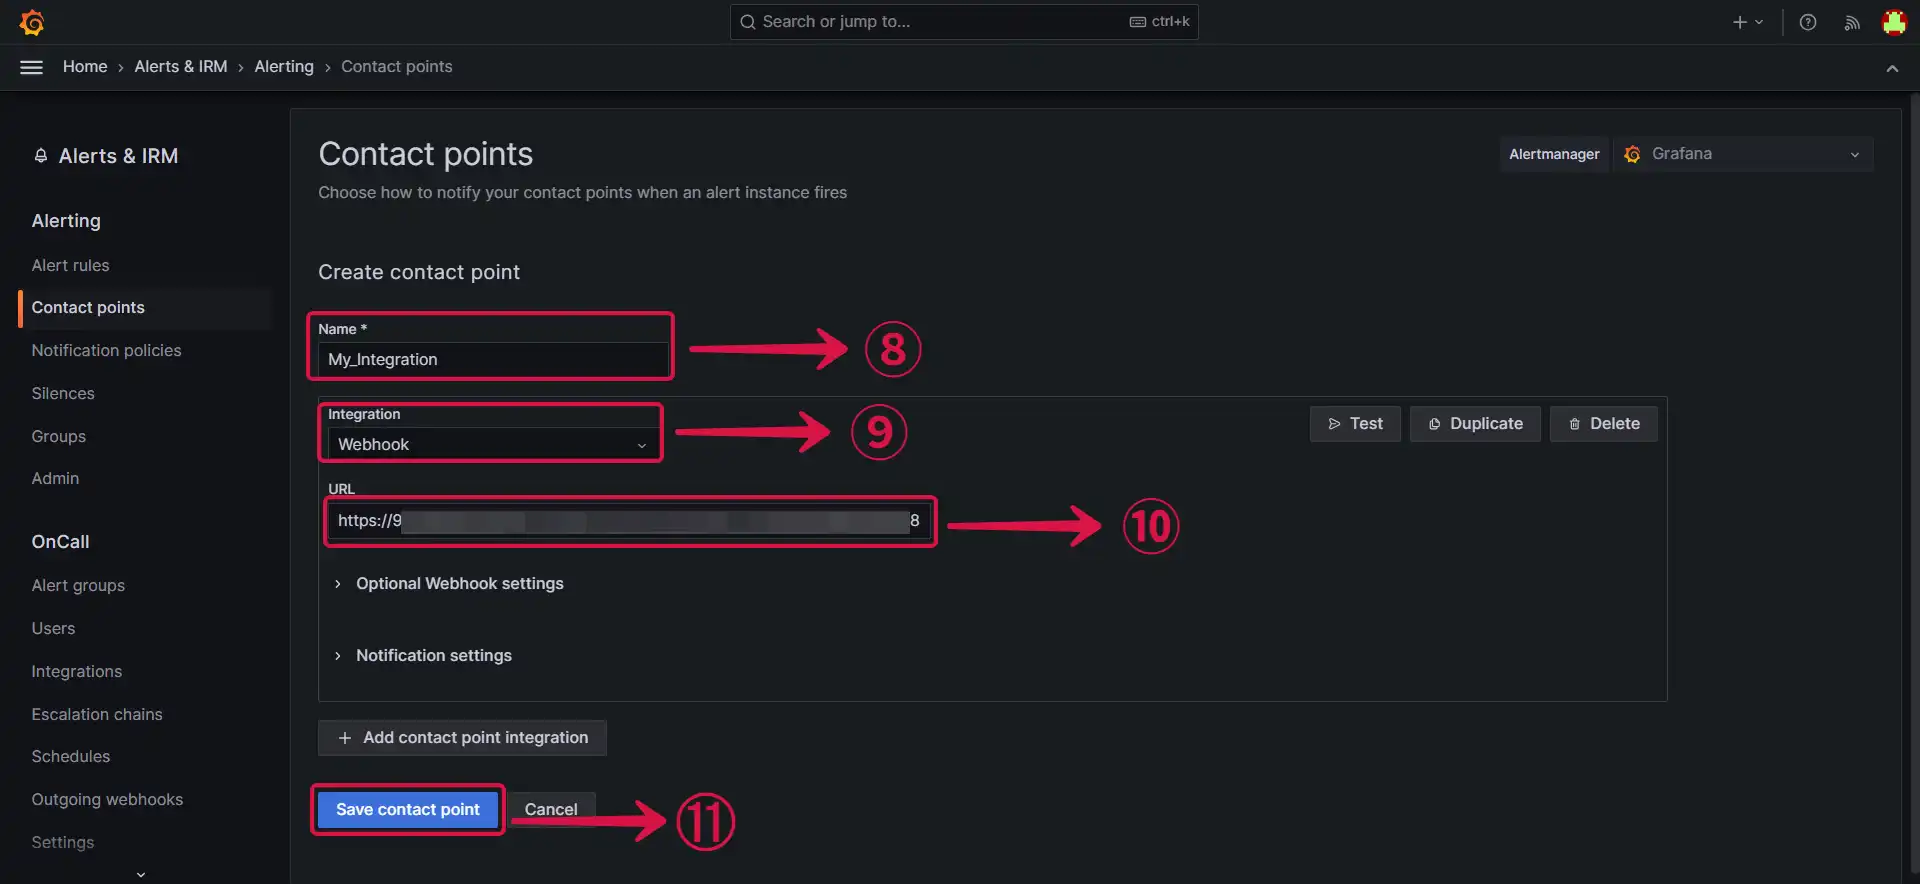
- Click Next⑫ and continue the configuration.
Learn more about Vanus and Vanus Connect in our documentation.